How-to guide
How to Calculate ROAS (Return on Ad Spend)
ROAS is one division: the revenue your ads brought in, divided by what you spent on them. The division takes five seconds, and every ad platform will compute it for you.
The two questions that actually decide whether your ads are profitable are harder. First: *whose* revenue number — the one the platform reports, or the one your till actually collected? Those are routinely different numbers, and the gap between them is where ad budgets quietly die. Second: what "good" means for *your* margins — a return that makes money for a 50%-margin jewelry maker loses money for a 25%-margin grocer, and no universal benchmark can referee between them.
The stakes are large and growing: the IAB and PwC's Internet Advertising Revenue Report put US internet advertising revenue at a record $294.6 billion in 2025, up 13.9% year over year — a pool that small businesses swim in alongside the big spenders, usually without a finance team checking the arithmetic. This guide is that arithmetic: the formula, the step-by-step, the break-even number your margin requires, the attribution traps that inflate what platforms report, and two worked examples with realistic numbers.
Quick answer: the ROAS formula
Spend $2,500 on ads and they bring in $9,000 of revenue? 9,000 ÷ 2,500 = 3.6. The same number gets written three ways:
- Ratio: 3.6:1
- Dollar multiple: $3.60 back per $1 spent
- Percentage: 360%
Google's own Ads glossary defines it as "total conversion value divided by total spend," represented as a percentage. One caution before you go further: some industry sources quietly compute a *profit*-based variant instead. That drift matters — see ROAS vs ROI vs CAC below — so when anyone quotes a ROAS number, the first question is always *which numerator?*
The ROAS Calculator does the division plus the break-even math this guide covers.
How to calculate ROAS, step by step
Step 1: Choose your revenue number — and say which one you chose
There are only two candidates, and both are legitimate if labeled honestly:
- Platform-attributed revenue — what Google Ads or Meta reports as driven by your ads. Easy to get, but each platform claims credit by its own rules (more on this in the attribution section), so the number runs high.
- Store-level revenue — what your business actually took in during the period, from all sources. Honest, but blended: it includes sales you'd have made anyway from organic search, repeat customers, and walk-ins.
Small businesses with one or two channels usually get the truth fastest from the store-level number; the platform number is for comparing campaigns *against each other*.
Step 2: Count all the ad costs
The denominator is not just platform spend if other costs exist to make the ads run: agency or freelancer fees, and creative costs (photography, editing) if you want the ads judged all-in. Payment processing fees on the resulting sales are usually better handled on the revenue side or in your margin — the payment processors guide shows what that 2.9% + 30¢ style pricing does per transaction.
Step 3: Divide
Revenue ÷ spend. $9,000 ÷ $2,500 = 3.6. Express it whichever way your team reads fastest — just stay consistent period to period.
Step 4: Calculate your break-even ROAS
This is the step most people skip, and it's the one that makes the number mean something.
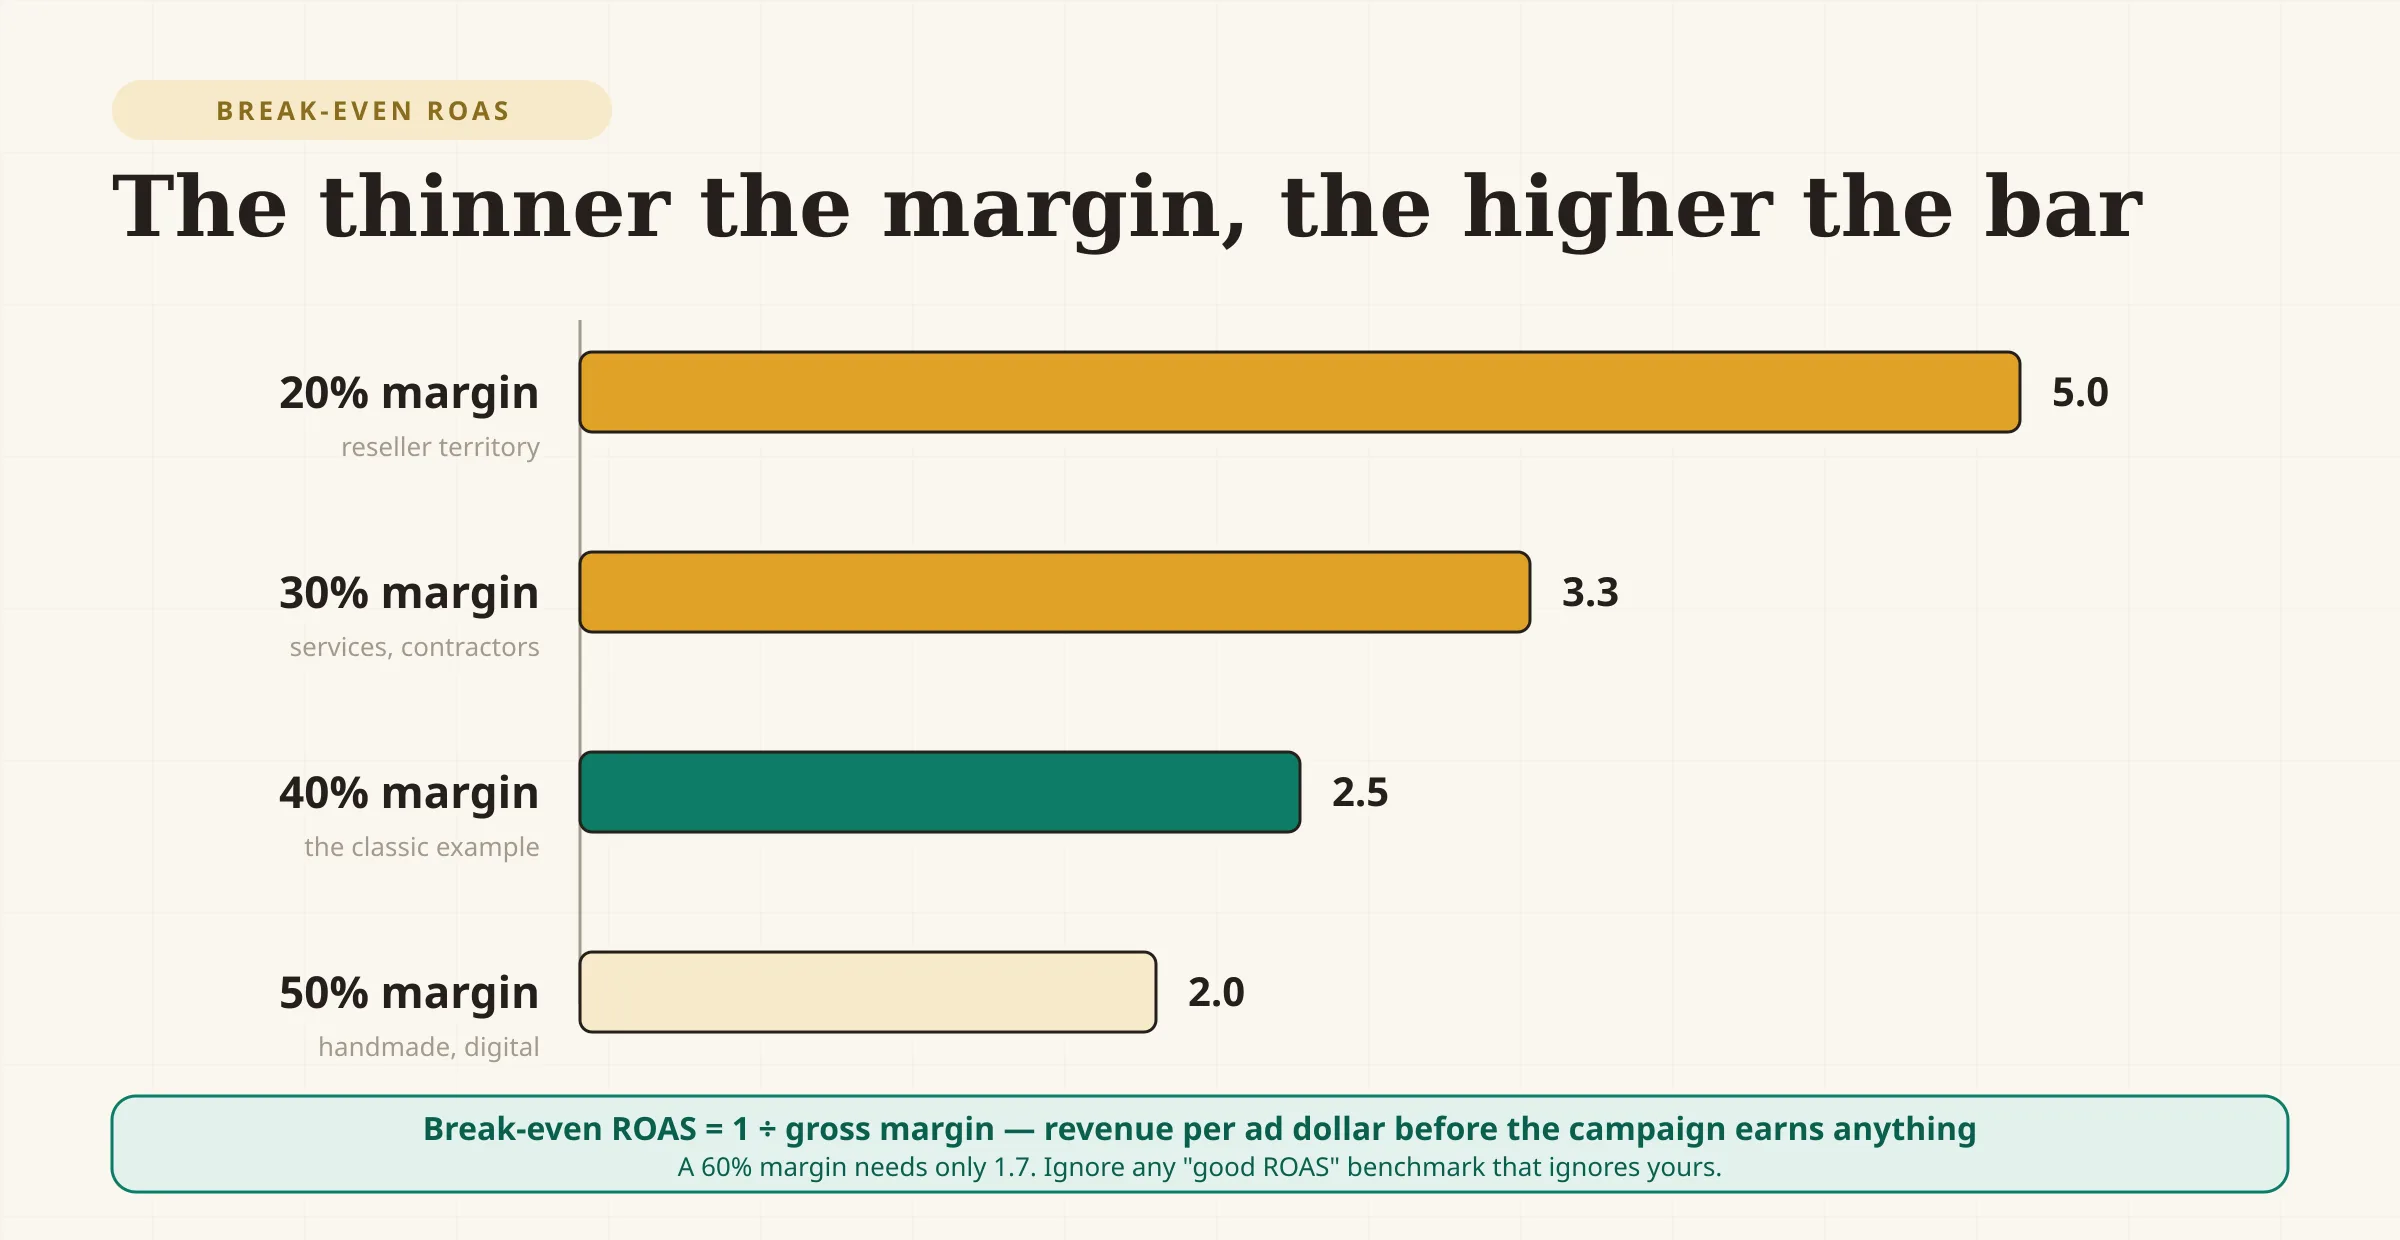
Sell a product for $100 that costs you $60 in product, shipping, and fees? Your gross margin is 40%. 1 ÷ 0.40 = 2.5. Below a 2.5 ROAS, every sale the campaign makes loses you money; the ads are just a machine for buying revenue at a markup you can't afford. Industry write-ups frame it the same way — Shopify's break-even ROAS explainer works the identical example: $100 price, $60 costs, 2.5 break-even.
| Your gross margin | Break-even ROAS |
|---|---|
| 20% | 5.0 |
| 30% | 3.3 |
| 40% | 2.5 |
| 50% | 2.0 |
| 60% | 1.7 |
Don't know your margin to within a few points? That's the real first step — the Profit Margin Calculator and the how to calculate profit margin guide fix that in a few minutes.
Step 5: Set a target that's a multiple of *your* break-even, not the internet's
A useful companion number: gross profit multiple = ROAS × margin. At 3.6 ROAS and 40% margin, ads return 3.6 × 0.40 = 1.44 — $1.44 of gross profit per $1 of ad spend. Want at least $2 of gross profit per ad dollar? Your target ROAS is 2 ÷ 0.40 = 5.0.
Ignore the "4:1 is a good ROAS" benchmark genre. It traces to agency blog posts — WebFX's is the most-circulated origin — with no primary source behind the threshold, and WebFX's own campaign dataset puts the cross-industry average at 2.26×, *below* its own "good" bar. The honest version of the benchmark is arithmetic, not folklore: 4:1 is simply the break-even ROAS of a 25%-margin business. Set targets from your margin, and let other people argue about averages.
Industry ROAS benchmarks: what's actually published
So is there a number to compare yourself against? Sort of — but it's important to be honest about what exists: there is no neutral, industry-wide ROAS standard. Every published table is one vendor's own client or tool data, and the two most authoritative names in the space publish no ROAS at all: WordStream/LocaliQ's 2026 search benchmarks cover 13,474 US campaigns but stop at CTR, CPC, conversion rate, and cost per lead — no ROAS anywhere — and Google itself publishes no industry ROAS figures.
The most complete public table comes from WebFX (published September 2025, drawn from the agency's own 2025 paid-search campaigns; sample size undisclosed):
| Industry (WebFX 2025 data) | Average ROAS |
|---|---|
| Heavy equipment & industrial machinery | 6.86× |
| Manufacturing | 5.36× |
| Energy, utilities & renewables | 3.31× |
| Local home services | 3.28× |
| Hospitality & travel | 3.04× |
| Retail & brick-and-mortar | 2.14× |
| Ecommerce & online retail | 1.73× |
| SaaS | 1.66× |
| Healthcare & medical services | 1.41× |
| Real estate | 0.92× |
| Non-profit | 0.88× |
| Media | 0.80× |
| Financial services | 0.70× |
| Cross-industry average | 2.26× |
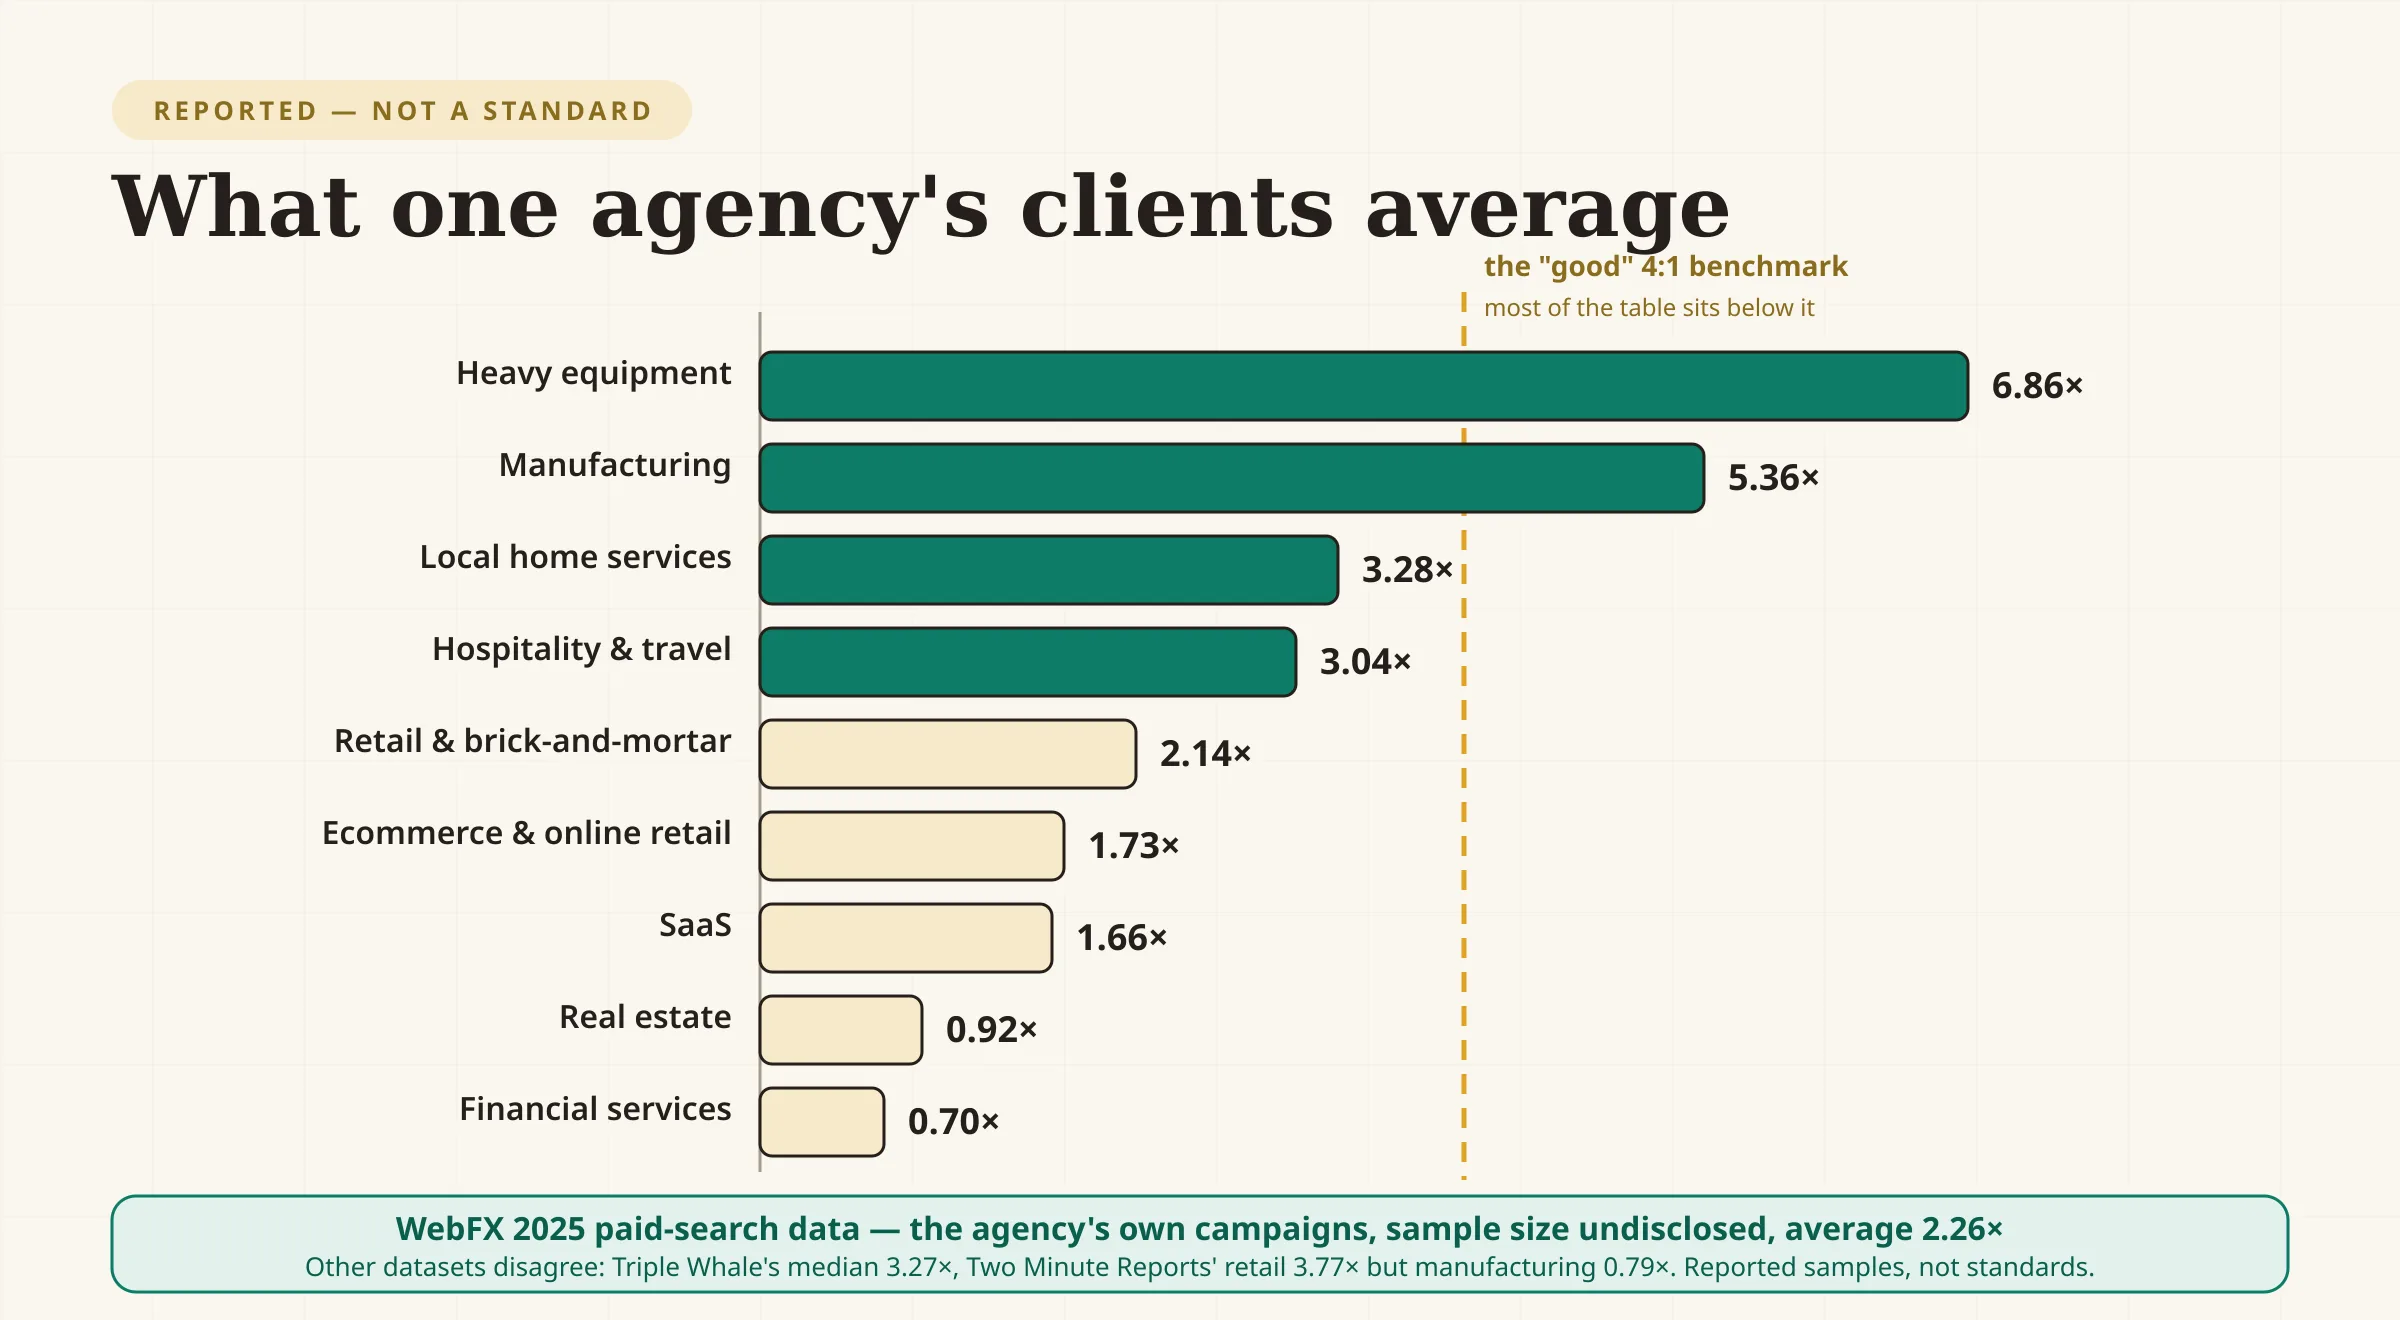
Three caveats before you compare yourself to any row of that table:
The sources disagree with each other — sometimes by 7×. Triple Whale's benchmarks (21,000+ ecommerce brands, Aug 2025–Jul 2026) put the median Google Ads ROAS at 3.27×. Two Minute Reports' 2025 medians have retail & ecommerce at 3.77× — but manufacturing at 0.79×, where WebFX has manufacturing at 5.36×. Varos's connected-account benchmark (April 2025 snapshot, 5,000+ companies) put the Google median at 3.31× and Meta at 2.19×. Same year, same metric, and the overall "average" spans 2.26× to 3.77× depending on whose clients you ask.
Every one of these is platform-attributed ROAS — the generous kind this guide has already shown runs high. Varos's own dataset makes the point: its search-channel median was 5.17× while video sat at 0.52×. A table built on platform-reported numbers inherits platform bias in proportion to its channel mix.
The most famous "benchmark" isn't a ROAS at all. The "businesses earn $8 for every $1 spent on Google Ads" line that benchmark pages recycle comes from Google's Economic Impact methodology — which defines it as estimated *profit including the value of organic search*, built on Hal Varian's 2009-era $2-profit-per-$1 analysis. It is not ad-attributed revenue ROAS, and WebFX's own "200% average" headline repeats the same mislabel.
Reference ranges: what "normal" actually looks like
Pull the published datasets together and a band emerges — reported 2025–2026 numbers, by business type:
| Business type | Reported range | From |
|---|---|---|
| Overall, cross-industry | 2.2–3.3× | WebFX 2.26× average; Varos 3.31× Google median; Triple Whale 3.27× median |
| Ecommerce & online retail | 1.7–4.4× | WebFX 1.73×; Two Minute Reports 3.77×; Triple Whale's vertical medians span 2.06–4.35× |
| Local home services | ~3.3× (one source) | WebFX 3.28× |
| Hospitality & travel | 3.0–15.2× | WebFX 3.04×; Two Minute Reports 4.59×; Varos's hotels figure 15.19× (via third-party republication — treat as the optimistic outlier) |
| SaaS & B2B services | 1.3–1.7× | WebFX 1.66×; Varos B2B SaaS 1.29× |
| Financial services | 0.2–0.7× | WebFX 0.70×; Varos 0.24× |
| Manufacturing | 0.8–5.4× | Two Minute Reports 0.79× vs WebFX 5.36× — the datasets' widest single-industry disagreement |
A quick way to read the overall band:
- Under ~1.5× — either the campaign is losing money at typical margins, or you're a lead-generation business whose revenue closes where attribution can't see it (real estate, financial services, and the contractor example all live here).
- 2–4× — the reported mainstream. Most businesses' honest numbers land in this band.
- Above ~5× — big-ticket, high-margin, low-frequency sales where one closing pays for months of ads, generous attribution, or both.
Now cross the band with the only standard that decides. At a 40% margin your break-even is 2.5×, so the low end of the mainstream band (2.2×) still *loses* you money — "normal" and "profitable" are different questions, and only your margin answers the second one.
The attribution trap: platform-reported ROAS is not your revenue
Both major platforms decide which sales your ads "caused" by rules that run in their own favor.
- Google Ads uses data-driven attribution as "the default attribution model for most conversion actions," per Google's attribution docs — an algorithmic model dividing credit across clicks, rather than the last-click convention advertisers were long used to.
- Meta's default attribution setting is 7-day click *or* 1-day view, per Meta's help center — a sale counts if the customer clicked an ad in the last week, or merely *saw* one within 24 hours. Meta's docs also disclose that where purchase events can't be counted directly, "statistical modeling may be used."
Run both platforms and both can claim the same sale. Add the platforms' reported ROAS together and the sum can exceed what your store actually earned.
This isn't platform slander; it's measured. A peer-reviewed study co-authored with Facebook's own economists — Gordon, Zettelmeyer, Bhargava, and Chapsky, published in *Marketing Science*, running 15 randomized US Facebook experiments — found that the observational, attribution-style methods platforms and analytics tools rely on "often fail to produce the same effects as the randomized experiments," and that in half the studies the estimated lift in purchases was off by a factor of three.
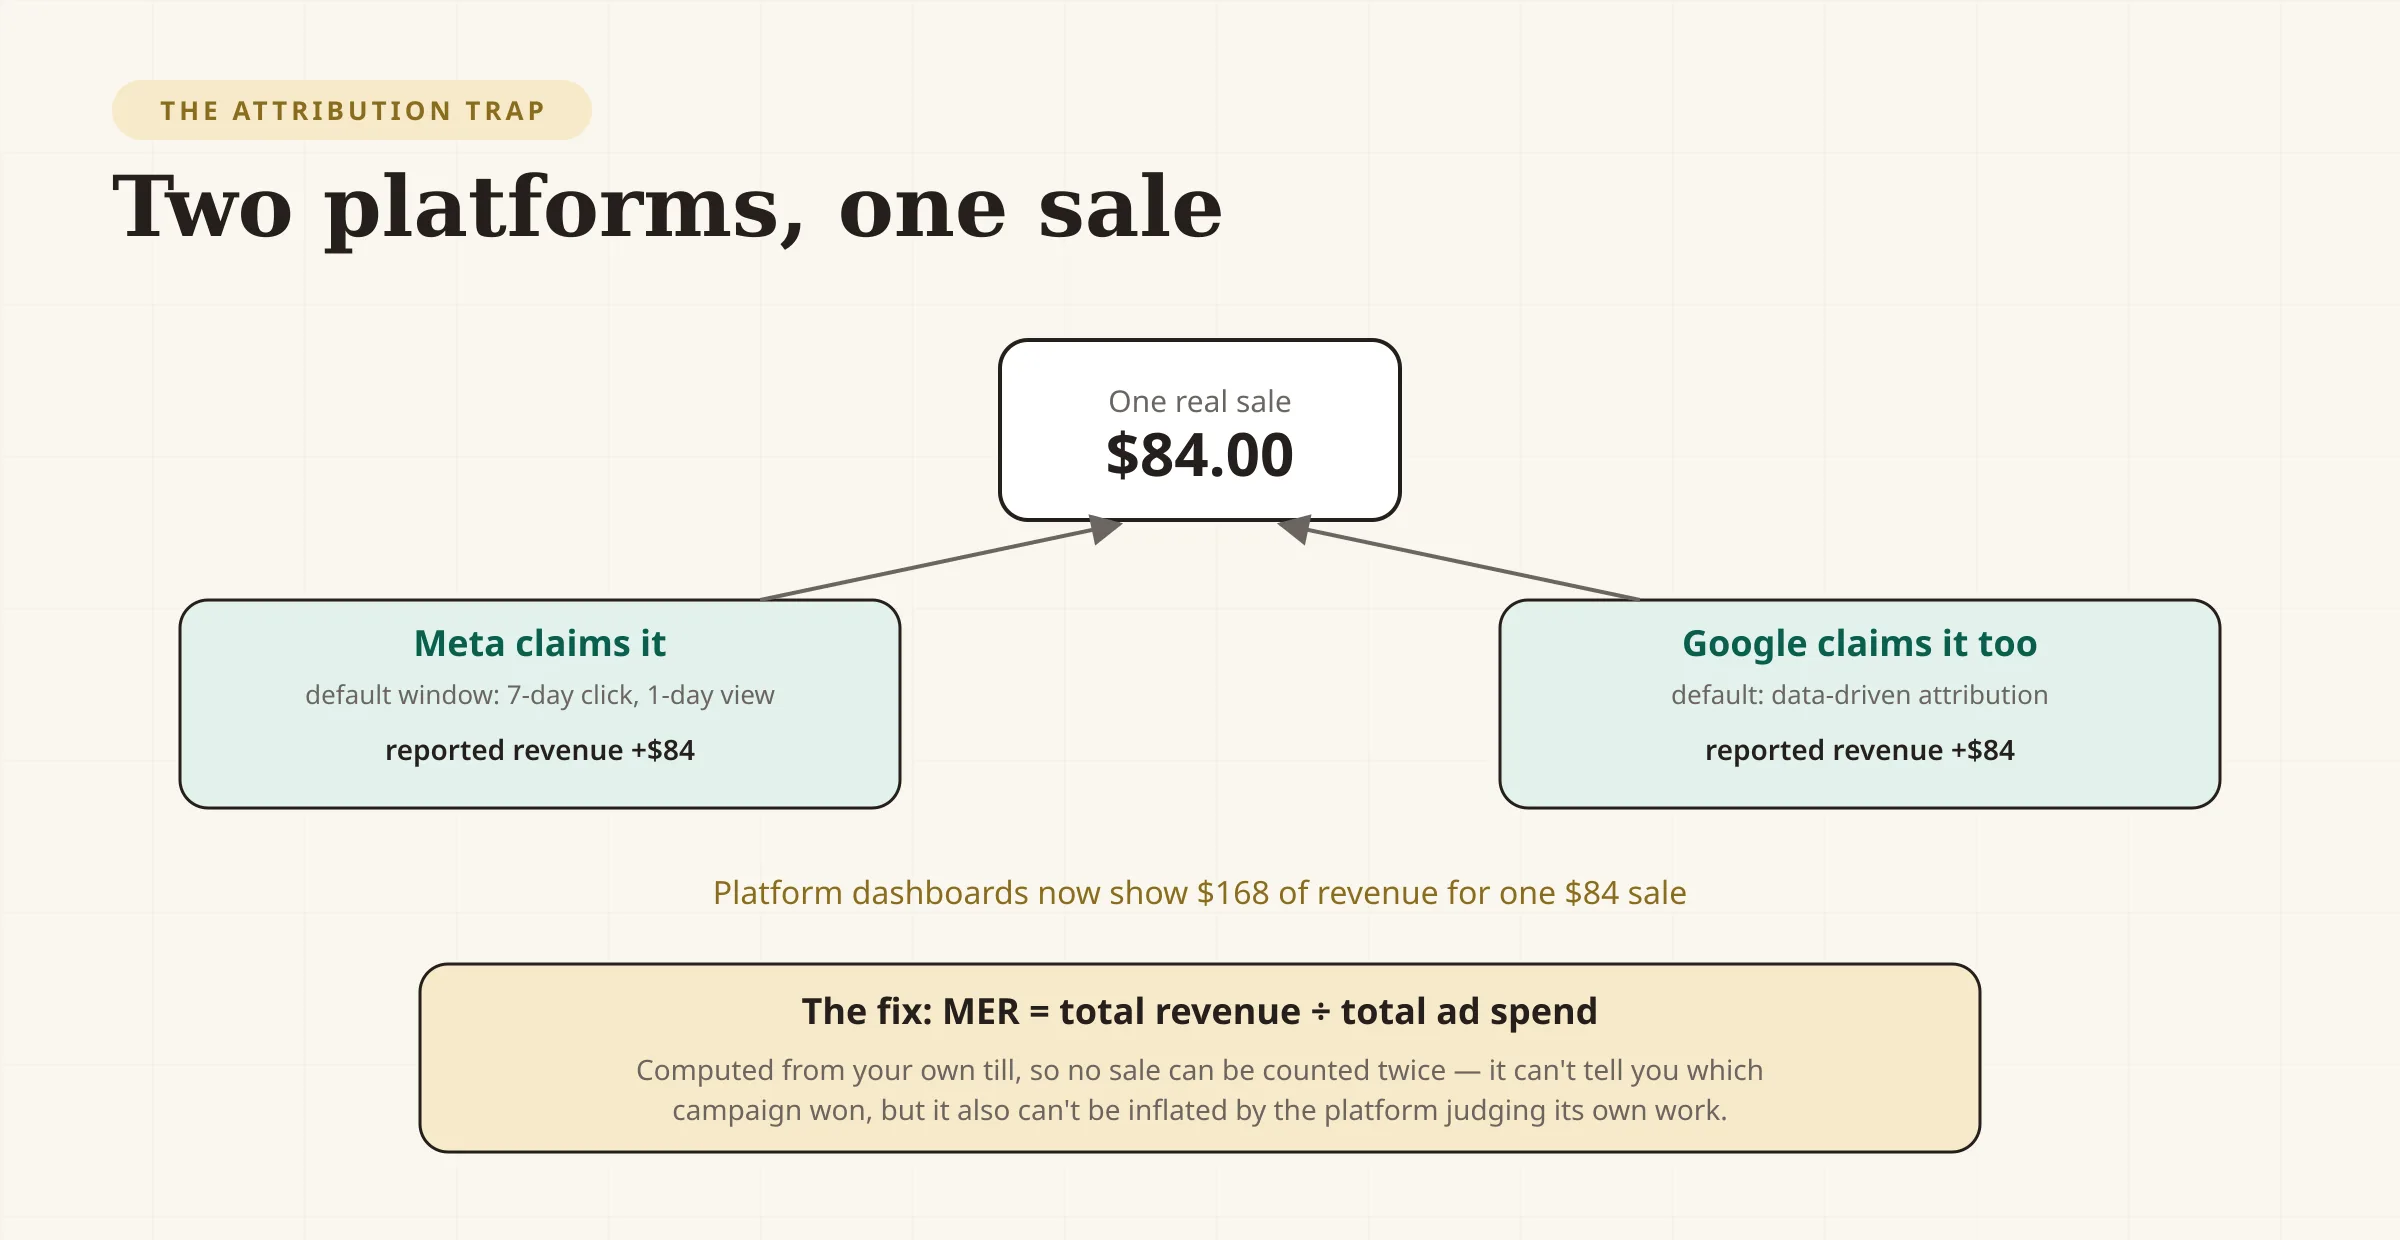
The practical defense for a small budget is a blended number:
Also called blended ROAS (Shopify's MER explainer covers the definition), MER uses your actual total revenue and actual total ad spend — no attribution opinions anywhere. It can't tell you which campaign did it, but it can't lie to you either. Use platform ROAS to rank campaigns against each other; use MER to decide whether the whole operation pays. When you want harder evidence on a single channel, change the spend and watch the blended number move — a 30% budget cut that leaves revenue flat is telling you something no dashboard will.
Worked example 1: the ecommerce shop
A two-person home-goods shop spends $4,000 in a month: $2,400 on Meta, $1,600 on Google. Meta reports $9,600 of attributed revenue (4.0 ROAS); Google reports $7,200 (4.5 ROAS). The platforms sum to $16,800 — 4.2 blended on their numbers.
The shop's actual revenue for the month, from its own store dashboard: $14,200, including repeat customers and organic search. Honest MER: 14,200 ÷ 4,000 = 3.55.
Gross margin is 45% (product, shipping, and processing fees included). Break-even ROAS: 1 ÷ 0.45 = 2.22. Gross profit multiple: 3.55 × 0.45 = 1.60.
$14,200 × 0.45 = $6,390 gross profit, minus $4,000 of ads = $2,390 profit the ads genuinely created. Same spend, same month — the platform story said 4.2, the honest story said 3.55, and the money in the bank is what the honest story predicted.
Worked example 2: the contractor buying leads
A kitchen remodeler spends $1,800/month on Google search ads. The ads don't sell anything — they produce 36 leads at $50 each (the cost-per-lead view of the same spend is in the CAC Calculator). He closes 1 in 4, books 9 jobs, average job $2,400.
Revenue: 9 × $2,400 = $21,600. ROAS: 21,600 ÷ 1,800 = 12. Margin after materials and subcontractors: 30%, so break-even ROAS is 1 ÷ 0.30 = 3.3 — the campaign clears it easily, at 12 × 0.30 = 3.6 gross-profit multiple.
The lesson in the contrast: never compare your ROAS to a business with different economics. A 12 ROAS that sounds spectacular for a remodeler would be unremarkable in high-margin services and catastrophic for a 20%-margin reseller. The only ROAS that matters is yours against your own break-even.
What belongs in the numerator (and what doesn't)
- Refunded sales don't. Use net revenue. A campaign with 25% returns has a real ROAS 25% lower than its dashboard's.
- Sales tax you collect doesn't. It's the state's money passing through — the how to calculate sales tax guide covers the mechanics, and the Sales Tax Calculator extracts it if your platform reports revenue tax-inclusive.
- Payment processing fees: either net them out of revenue or count them in costs — pick one basis and keep it.
- Pass-through shipping you charge at cost isn't revenue either.
Small corrections individually; a distortingly wrong number when skipped together.
ROAS vs ROI vs CAC: same numbers, different questions
- ROAS asks: how much *revenue* per ad dollar? Google's glossary keeps it and ROI firmly separate —
- ROI asks: how much *profit* per dollar? Google defines it as "total profit divided by total spend." Note that some industry sources redefine ROAS itself on gross profit ("margin-adjusted ROAS") — the terms genuinely drift across sources, so always ask which formula produced the number on the screen.
- CAC asks: what does a *new customer* cost? ROAS counts revenue from everyone including repeat buyers; CAC divides spend by new customers acquired, and pairs with customer lifetime value for the long view.
Campaign decisions live in ROAS; business decisions live in CAC and LTV. The CAC Calculator handles the second; the Marketing Budget Calculator works backward from what you can afford to spend at all.
Common mistakes
- Trusting platform-attributed revenue as revenue. It's an estimate computed by rules that favor the platform doing the estimating.
- Adding platform ROAS across platforms. Both can claim the same sale; the sum can exceed reality.
- Benchmarking against "4:1" or industry averages. Unverifiable thresholds; your break-even is arithmetic, not folklore.
- Calculating ROAS without knowing gross margin. You cannot judge the number without the break-even it must clear.
- Comparing ROAS across businesses (or channels) with different margins. A 3 that thrives at 45% margin starves at 30%.
- Leaving refunds and sales tax in the numerator. Both inflate the ratio with money you don't keep.
- Comparing campaigns on different attribution settings. Change the window, change the number.
- Judging a scaled budget on first-order revenue only. If a third of ad customers reorder, first-order ROAS understates the campaign.
- Scaling spend on a platform-reported number during a growth phase. The organic growth in the same period takes the credit.
Checklist
- Revenue basis chosen — platform-attributed or store-level — and stated
- All ad costs counted: spend, fees, creative
- Refunds and sales tax excluded from revenue
- Gross margin known and recent
- Break-even ROAS calculated as 1 ÷ margin
- Target set as a multiple of break-even, not a benchmark
- MER computed from the till as the honest check
- Campaigns compared only under identical attribution settings
FAQs
How do I calculate ROAS?+
Divide the revenue your ads generated by what you spent: $9,000 of revenue on $2,500 of spend is `9,000 ÷ 2,500 = 3.6`, written 3.6:1 or 360%. The [ROAS Calculator](/tools/roas-calculator) does it plus the break-even math.
What is a good ROAS?+
There is no verified universal standard — reported cross-industry numbers cluster between about 2.2× and 3.3×, and the widely repeated "4:1" traces to an agency blog with no primary source (it's just a 25%-margin business's break-even). The only benchmark that decides whether *yours* is good is your own: break-even ROAS = 1 ÷ your gross margin, then target a comfortable multiple of it. See [the industry benchmarks section](#industry-roas-benchmarks-whats-actually-published) for the full ranges by business type.
Is ROAS the same as ROI?+
No. ROAS divides revenue by spend; ROI divides profit by spend. Google's glossary defines them separately. Some industry sources blur the two with "margin-adjusted" ROAS variants, so always confirm which formula produced a quoted number.
What is break-even ROAS?+
1 divided by your gross margin. A 40% margin means `1 ÷ 0.40 = 2.5` — each campaign must return $2.50 per ad dollar before it earns anything. Thinner margins need higher ROAS: 20% margin requires 5.0.
Why does my ROAS differ between Google, Meta, and my store's numbers?+
Different attribution rules. Google defaults most conversions to data-driven attribution; Meta's default setting counts 7-day clicks and 1-day views, and both platforms can claim the same sale. Your store's own revenue is the only number that can't double-count.
What is MER, or blended ROAS?+
Total revenue divided by total ad spend, computed from your own sales data rather than any platform's attribution. It can't allocate credit between channels, but it also can't be inflated by them — which makes it the right number for judging whether ads pay at all.
Should returns be included in ROAS?+
No. Use net revenue after refunds. A store whose ad-driven sales return at 25% has a real ROAS 25% below what the ad platform reports.
What's a good ROAS for a service business?+
Service businesses with high margins and large job values routinely post ROAS of 5–10+ that a product reseller could never match — a remodeler at 30% margin breaks even at 3.3 regardless. Judge ROAS only against your own break-even, never across business types.
What to do next
Run three numbers this month: your gross margin, your break-even ROAS, and your MER. Margin first, with the Profit Margin Calculator; division and break-even with the ROAS Calculator; spend planning with the Marketing Budget Calculator and CAC Calculator. If your MER clears your break-even comfortably, scale slowly and watch the blended number as you go — and if it doesn't, the pricing strategies guide is usually where the real problem gets solved.
Free tools to try
Keep reading
Guide
How to Calculate Profit Margin (Formula + Examples)
How to calculate profit margin step by step — the formula, the difference between gross, operating, and net margin, and worked examples with real numbers.
Guide
Small Business Pricing Strategies: The Complete Guide
The pricing strategies that work for small businesses — cost-plus, value-based, tiered, and premium — how to choose one, and how to raise prices without losing customers.
Guide
Best Payment Processors for Small Business (2026)
11 payment processors compared for small businesses — real 2026 fees for Square, Stripe, PayPal, Helcim and more, plus when interchange-plus saves money.